Take a look at these headlines.
“Stocks extend rally after inflation slowdown” — The Wall Street Journal.
“After months of stubborn inflation, glimmers of hope emerge.” — The New York Times.
“Stocks gain on inflation giddiness.” – Barron’s.
There are dozens more and 13 years of trading tells me this is a trap.
I’ll show you a metric from 2008, so you see where this is going.
But first, let’s back up a little and look at an excerpt from the Wall Street Journal.
“Boosted by hopes that inflation in the U.S. is cooling, stocks capped a volatile week with the most significant gains in months. The S&P 500, Nasdaq, and Dow Jones added 5.9%, 8.1%, and 4.1% for the week, respectively, their best performance since June.
Shares of big tech companies raced higher too. Amazon’s stock added 4.3%, bringing gains for the week to almost 11%. Alphabet shares rose 2.6% and were up about 11% for the week. Even more-speculative growth companies participated in the rally.
Even Beijing’s move to ease pandemic restrictions added to the market’s buoyant mood. As soon as health authorities confirmed Beijing was shortening the time travelers must stay in quarantine, prices for crude oil climbed 2.5% to $95.99 a barrel.”
I do not deny this happened.
But there’s so much cheerleading from the financial media most people believe this is a hint inflation could be moderating and that we’re headed to new all-time highs.
With economic data, there’s always a chance of a head fake.
To put this in context, I want to tell you about September 2008.
The entire market was falling apart…
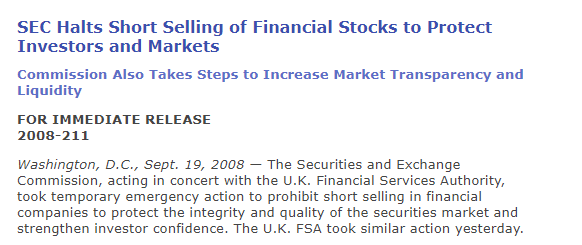
And the powers decided to stop the bleeding by banning short-selling.

SEC News
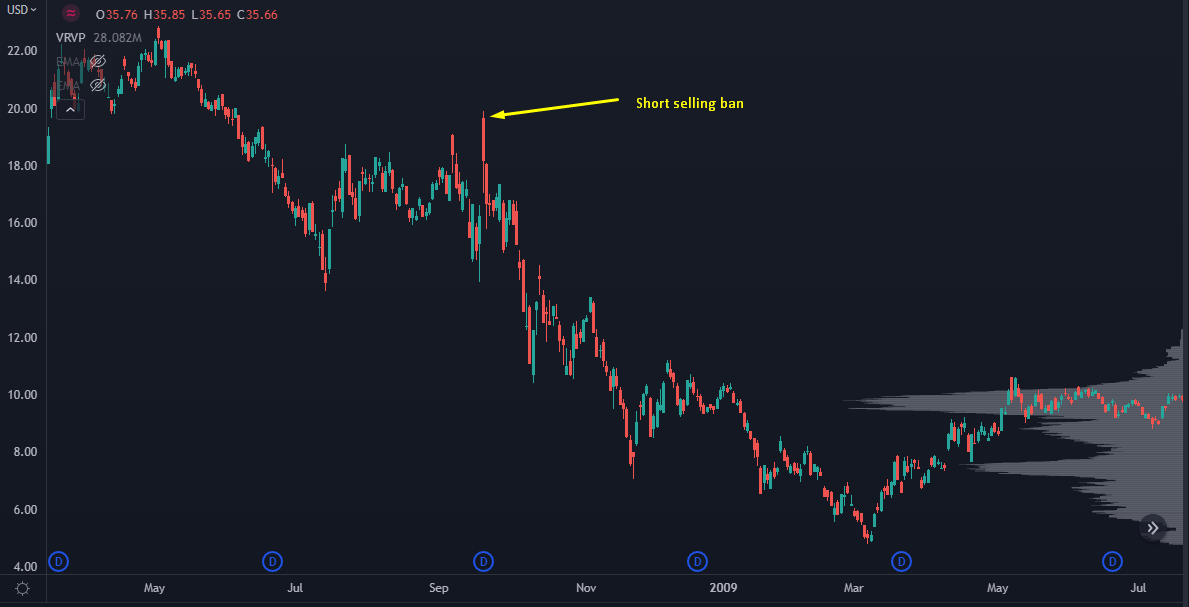
Bank stocks rallied by 10% on that news, and many investors threw caution to the wind, betting the farm on so-called “money-in-the-bank” retirement tickers.
What happened next was one of the biggest shocks in financial history.

Chart
Complete disaster!
Forced deleveraging and liquidations on an institutional level took everything downhill.
And it took many investors ten years to recover their losses.
I hate comparing it to 2008, but I think it’s fair to say we are in a bear market.
That’s why I get a little suspicious when we see a big “gap and go” in economic data that suggests an all-time high is on the horizon. Most people don’t realize it, but these “higher moves” have been a source of liquidity for months, and we may see that again.
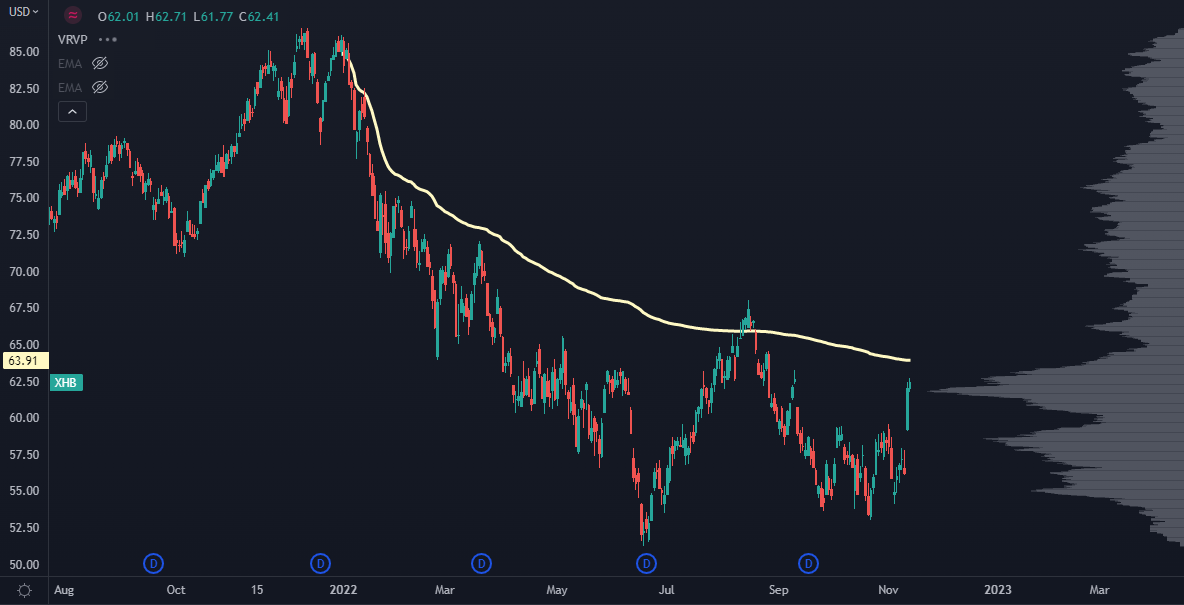
A great example is the homebuilder ETF – XHB — which provides exposure to the homebuilder’s segment of the S&P TMI… and Allows investors to take strategic or tactical positions at a more targeted level than traditional sector-based investing.
Now, of course, the housing market was battered in 2022.
But do you see where the peak is?

Chart
That was a colossal move higher on CPI (consumer price index) data — a measure of the average change over time in the prices consumers pay for goods and services.
The chart shows a ton of volume traded on positive CPI data.
Meaning consumer prices dropped that week.
But then what happened two weeks later?
A massive selloff that put thousands of portfolios in the red.
That usually happens when holders use positive CPI data to “get liquid.”
The point here is not to make investment decisions based on what’s in the news.
That kind of approach is unsustainable and will only drive you nuts.
A straightforward approach is to have a reliable framework that gives you a sense of where stocks are headed and what moves to make with the best risk/reward setup.
This way, your investment decisions are driven by logic, not emotions.
In this free training, I explain a simple framework that works for my clients and me.
Feel free to watch and reach out with any questions.
Original Post Can be Found HERE


