Last week’s market was an absolute meat grinder.
One look at Friday’s closing prices would’ve made the overall market seem dead in the water.
Yet, the intraday volatility was insane.
Here’s the thing:
All that volatility could be indicating bullishness.
That’s what we talk about in today’s Market Primer.
Check out the video now:
Once you’re done…
Head here to watch the free training I mentioned in the video.
Written analysis is below:
SPY
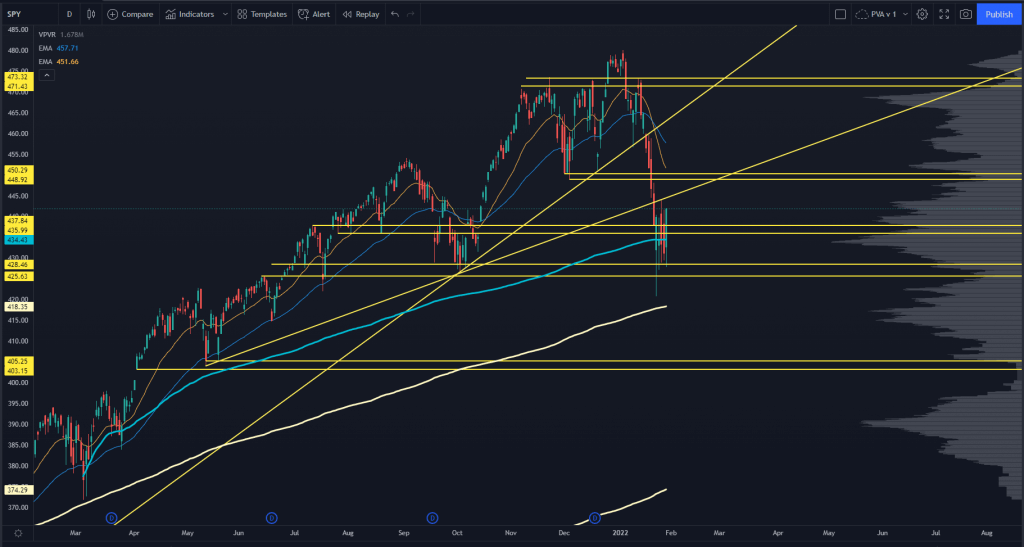
Like I said, we just went through a meat grinder last week, but there was plenty of intraday volatility.
Unless something truly comes out of left field, I think we’re close to a bottom.
Note that I didn’t say THE bottom.
We’ve seen multiple instances of modern markets retesting the lows with momentum divergences.
“V” bottoms are the exception and not the rule — and this is coming from the guy who said, at the exact lows in March 2020, that we would not see a retest of those levels.
If you need examples of how this can play out, consider:
- August 2015
- January 2016
- Volmageddon (March 2018)
- October-December 2018
- Summer 2020
More examples are further back, but these illustrate just what the market could do over the next few months.
That said:
I’m confident that the risk is now to the upside, not the downside.
Major indices all collected key levels, large-cap tech is getting through earnings and holding…
And we now know the projected Fed policy over the next few months.
So let’s talk about the upside in the market:
On our roadmap, we have the very obvious levels at 448-450 that could be clean resistance levels. This also aligns with a declining 20 Exponential Moving Average (EMA) and the swing Anchored Volume Weighted Average Price (AVWAP) from the all-time highs.
This level appears entirely too clear. That could indicate too many eyeballs are on it.
This can lead to one more stop-run to the upside, which I think will happen. There are some options-related mechanics we’ve touched on over the past few weeks that can add fuel to the fire and ignite a squeeze further than most peoples’ expectations.
Remember, volatility runs both ways.
Levels above that are pretty clean. We have the Low-Volume Node (LVN) at 454, and then the next one at 460. I would be VERY impressed if the market ran 5% without a break, but we do have precedent.
If these truly aren’t the lows, we’ve got 416-418 — the swing AVWAP from the March 2020 lows and a key internal pivot level from the Summer 2021 trading range.
QQQ
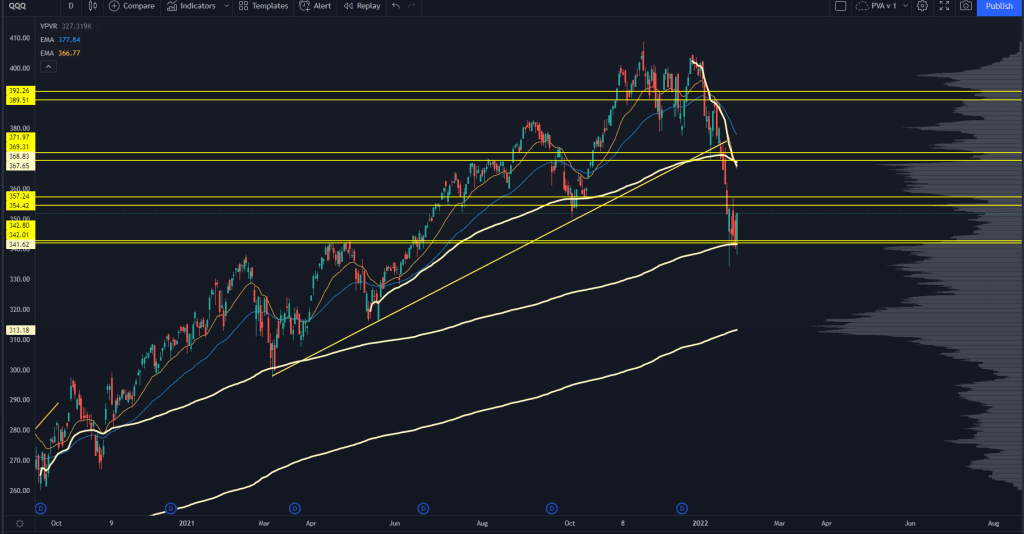
Here are some notes from last week’s analysis:
“At the other end of this volume pocket is a massive volume shelf coinciding with Spring 2021’s resistance levels. This is a massive level of interest for me, and I will be playing off it if we get it.”
That was the level to play during Monday’s capitulative move.
Now look. When volatility runs hot, it’s not unusual for the market to blow past a “clear-as-day” level, only to see it hold. Throughout the rest of the week, QQQ continued to find aggressive buyers as we headed into that 340 level.
Just like the SPY, I think odds favor upside right now. We’ve got a level of interest at 354-357 that’s a prior resistance level from Q4 2021.
Above that is that tricky range where I thought liquidity would show up for the Nasdaq. Given that speed, we don’t have many short-term market participants that traded at those prices, so it’s more muddled.
I think we can squeeze higher and faster than what many think, and the 367-369 levels are the ones to watch.
It lines up with some key AVWAPs and is probably the best spot to start initiating short exposure. We’ve got some tech earnings coming up soon, which may dramatically affect QQQ.
IWM
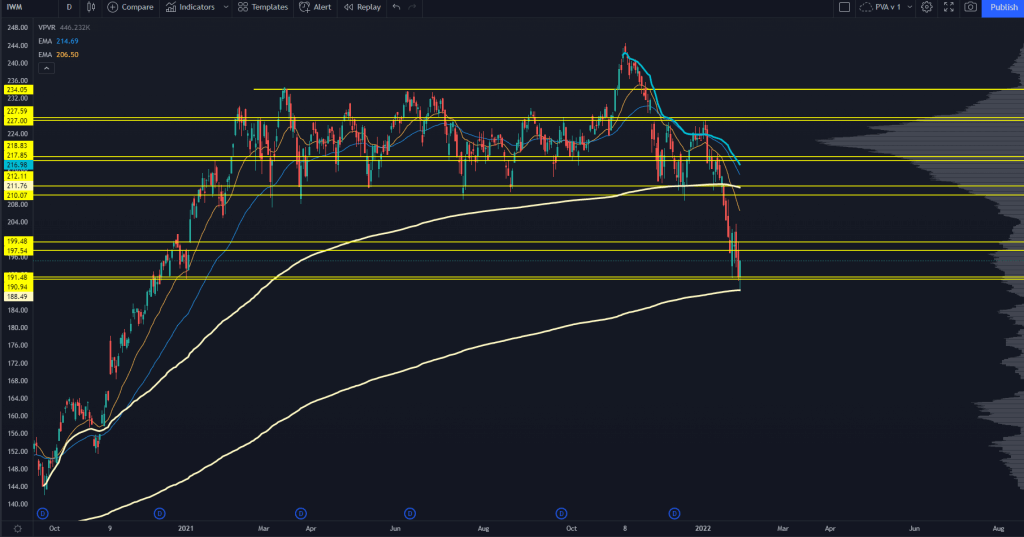
The Russell 2000’s price action was a work of art last week.
Keep in mind: The drawings you see on this chart were drawn a while ago. That’s how well our Trading Roadmap can work.
So Monday hits, and the Russell comes into the December 2020 – January 2021 support levels. We saw an instant response to that as soon as we tagged that level, then saw the index go into the high-vol trading range that we noticed everywhere else.
Then, Friday comes around, and we crack the lows…
Right down to the swing AVWAP from the March 2020 lows. Instant response there, and we close at the highs on Friday.
Just like the other indices, this feels like a bullish progression.
It’s quite possible much of the market’s leverage was washed out starting in November, and we’re now on the other side of it. I’m hesitant to call this the low for the year in the Russell, yet it was a 22% correction from November.
If you want to call this a bear market, which is reasonable, you still have to discount upside risk.
If you want to be bearish, you don’t want to see a test of 210 — the range lows.
Instead, you want it to be so weak over the next two weeks it can’t even come into those levels as traders use any pop to bail out of their positions.
My bullish thesis is that much of that occurred last week with the high volatility range — and now, we may not have any inventory left to sell unless we get higher prices to bring out other timeframe sellers.
210 will be too obvious of a level if we test it. Look for the early shorts to get stopped out, and then look for 212-217 as that will line up with some better levels.
I know that’s a very wide range…
If you’re trying to nail the top, how you scale in will dictate your success into February.
VVIX and VIX
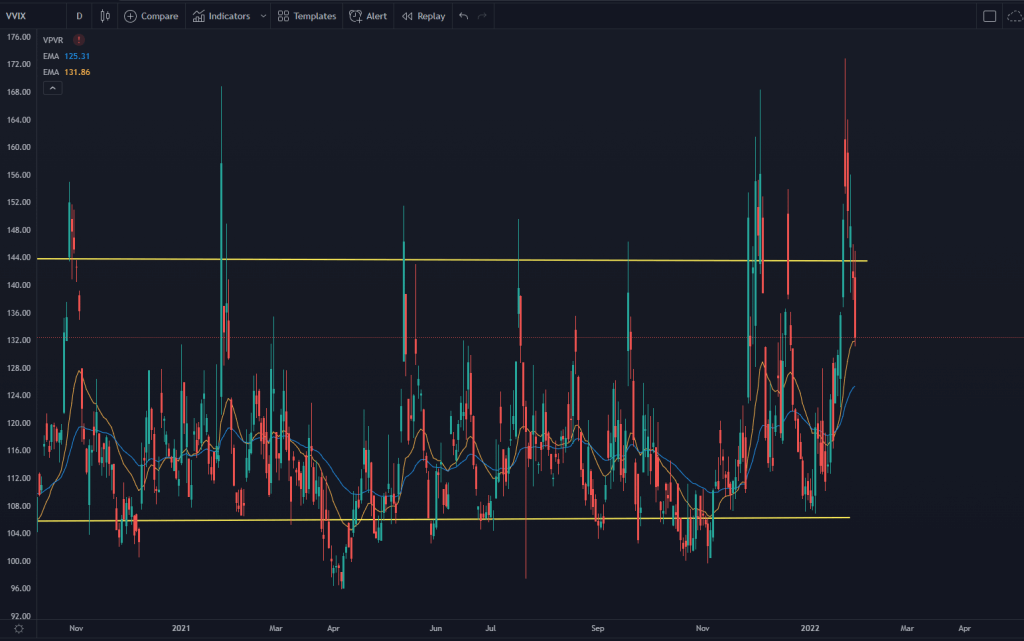
One confirming indicator for the bull thesis is VVIX, CBOE’s volatility index. It traded into 170 with the market liquidation on Monday but continued to drag lower.
Here’s why:
Anyone that needed to hedge already did.
It’s that simple.
If you were scared of the Fed and tech earnings, you probably picked up some VIX calls, then sold some into the Monday spike.
The broad markets could quite possibly fail to sell off aggressively again because everyone and their mother is hedged to the teeth, and it will take a month or two for the hedging to burn off.
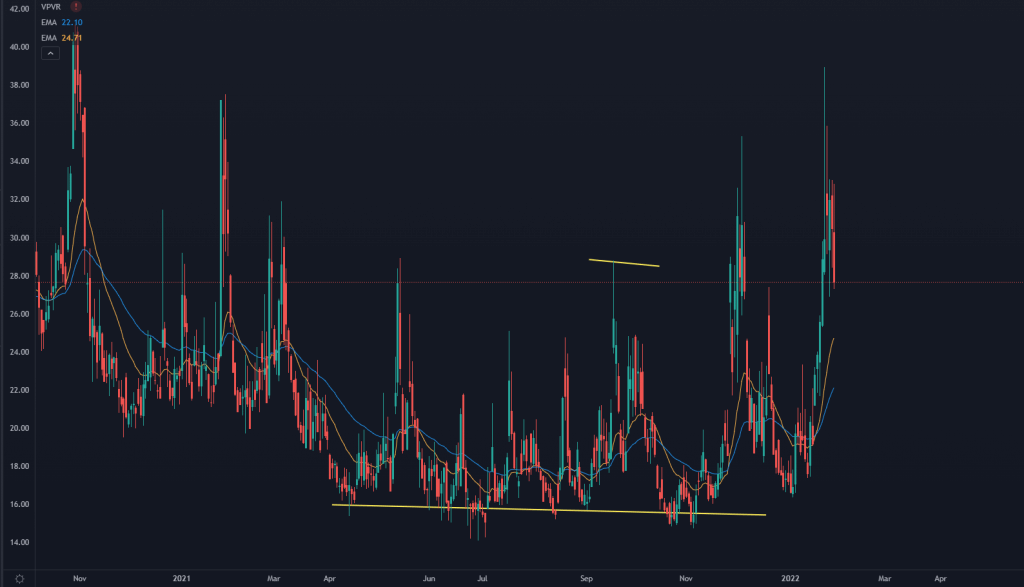
This is further reinforced by how spot VIX traded last week.
The demand for hedging is much lower, and the same mechanic exists in the SPX markets — anyone that needed to hedge already did.
Inside our PVA service, we’ve picked up some aggressive upside positioning over this past week.
If you’d like to see how we trade with the roadmap I used in this analysis:
Watch this free training here.
I’ll also show you how to join PVA today if you’d like to access our full portfolio, so watch that training now!


