Steve Place here, and I’ve got a brand new entry in our Market Primer series (formerly known as our Index Analysis series).
If you missed our first entry last week:
In each of these videos, we break down the major indexes using our market roadmap…
Offering you a chance to see where the markets could be headed in the short- and medium-terms.
Let’s get right into it. Here’s the video:
Keep reading for a written version of today’s Market Primer.
SPY
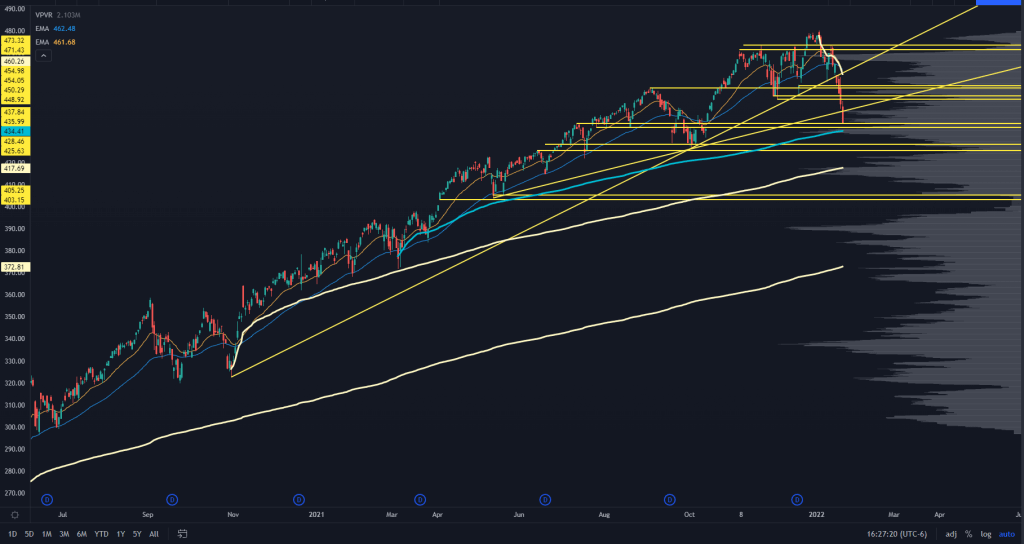
Here’s what I said about the SPY last week:
“There’s a tendency for the market to test the lower end of the range after a failed breakdown, and that could quickly accelerate if the intermediate term trendline is broken.”
Looks like we nailed it!
Another snippet from last week:
“Below that is a stupid obvious support level that will have entirely too many eyeballs on it. Either we don’t test it at all, or we (most likely) knife through it to get a proper stop run.”
The market’s bearish thesis worked out…
Yet it’s different altogether trying to trade it.
If you went into last week looking for retracement shorts, you had a single opportunity going into a small resistance level at 458…
And that was a level that just continued to find sellers since the gap down hit on January 18th.
Hindsight is great, but what about now?
One positive development last week was that the “generals finally got shot.”
After holding up well, names like AAPL and MSFT finally saw selling accelerate — and that had an outsized effect on the indices.
We also did see a VVIX reading over 145. That’s put the broad market at a tradeable bottom any time that level has been breached over the past two years.
The S&P finished close to a large pivot level and key Low Volume Node (LVN), right into 436/437.
You also have a swing Anchored Volume Weighted Average Price (AVWAP) from March coming up to catch price right into that level, which could provide a bit of support.
You’ll probably need to go through the top 6 stocks (MSFT, AMZN, AAPL, FB, TSLA, GOOGL) to see if/when they come into tradeable levels because they will help to provide support in this market.
Underneath that, we have Fall 2021’s key support levels. That will coincide with the swing AVWAP from November 2020, if it doesn’t get there too fast. However, if we get there quickly, we won’t see that AVWAP level coincide with it.
It’s not unreasonable to expect a bounce here, but bet sizing matters. When broad markets hit a liquidity break, it’s a “here or there” kind of mechanic.
What I mean is that the current price level is not “sticky.” The odds we see a range trade is much lower than the other two scenarios: a face-ripper rally or another fast move to the next level lower.
On the upside, you can make a case for a few short levels to play, ranging from 448 – 454.
I’d caution not to go “all-in” on any shorts. We’ve seen many instances where the squeeze higher goes longer and further than what most people think.
There’s also the options-related mechanics. January options expiration may be affecting the markets, leading to higher volatility.
Now, we have an instance where market participants are super hedged up, the VVIX is above 145, spot VIX is trading above 28, and the VIX futures curve is *finally* backward.
You also have a mechanic where large players will start selling short-term calls with way too much size…
And that can lead to a squeeze in the market directly related to the option mechanics surrounding weekly options around the indices and large-cap tech stocks.
So if we do bounce, look for the obvious short levels to be a little too obvious.
We talked about this last week — the lower end of the range just had too many eyeballs on it, and those early longs have been in serious trouble for a few days.
The opposite can happen where, if speculators start shorting too aggressively on the 450 retest, they will place their stops in obvious places, and the market will jam through them.
QQQ
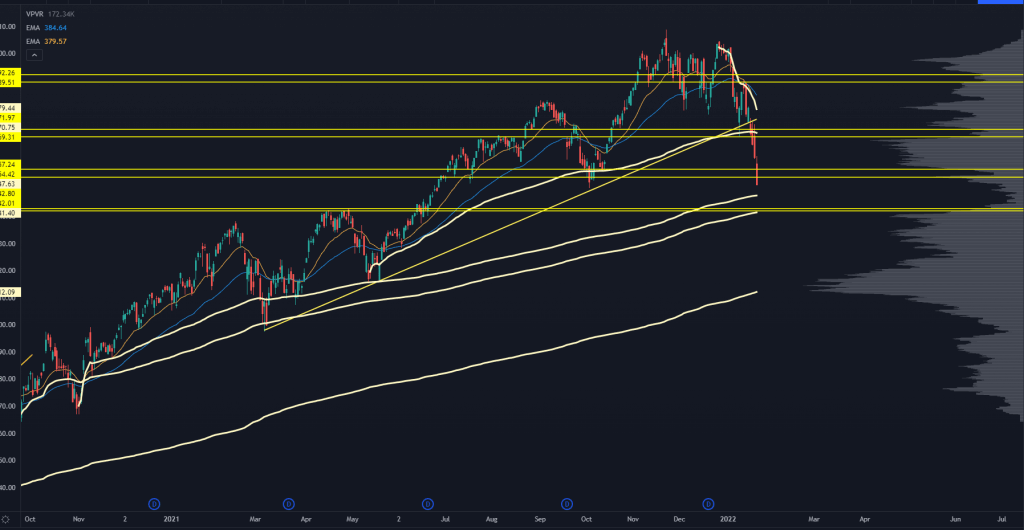
Since I mentioned some of my winning S&P calls from last week, let me tell you where I was dead wrong:
“This doesn’t mean that we’re going to crack and go straight down from here. There has been a massive amount of volume traded between 355-370, and that prior liquidity footprint can slow down the selling.”
Wow, nope.
We blew through that range in a day and a half. That key level at 354 held for about 90 minutes before selling accelerated.
Since the Nasdaq has more exposure in “the generals,” we should expect this to roll over fairly aggressively.
We are coming into a huge volume pocket. I wouldn’t even classify it as a Low Volume Node (LVN) — just a place where we haven’t seen a lot of trade there.
This low volume range goes from 342-355. We do have a swing AVWAP coming into play, but it’s an “orphan” indicator and may not provide any information.
If you’re going to trade the Nasdaq this week, you’ll get a lot more info looking at the key levels on AAPL and those kinds of names.
At the other end of this volume pocket is a massive volume shelf coinciding with Spring 2021’s resistance levels. This is a massive level of interest for me, and I will be playing off it if we get it.
Same playbook with the option mechanics as the SPY — January opex is out of the way, we have a ton of hedging put on, and there’s a real possibility of an options-related squeeze higher.
370 would be a huge retest level. That lines up with some pivot levels, along with the swing AVWAP from the December highs.
If the SPY comes into its levels with the QQQ right there, it’s a reasonable place to offload risk and consider some short exposure.
IWM
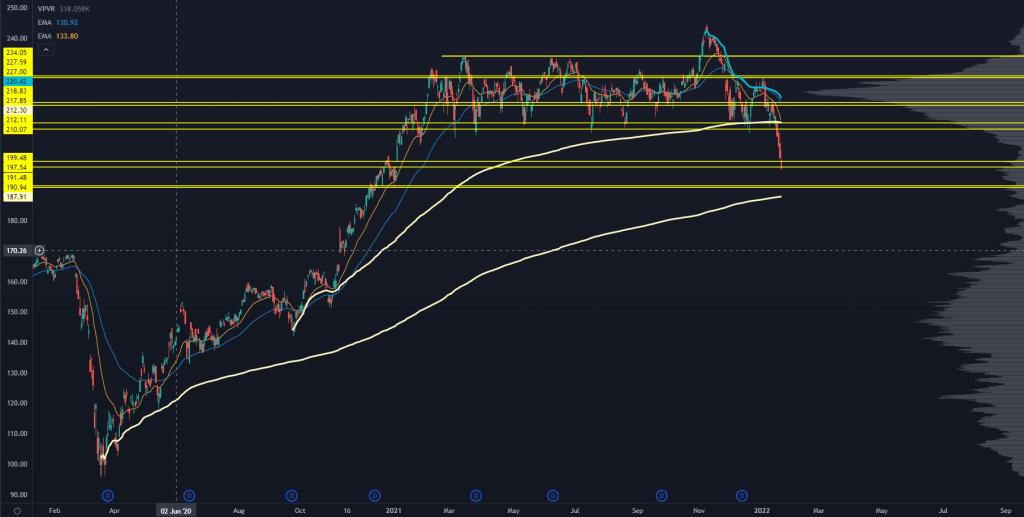
The Russell broke down under its range and simply has not had any relief since then. That’s the issue when the index runs straight up after the 2020 election.
This is the spooky index right now.
You have an entire year of distribution at higher prices, which will incentivize many investors to sell at higher prices.
The next key level to watch is 151.
This is a small LVN and the AVWAP from the March 2020 lows. If we were to get there in short order — say, Monday or Tuesday — I would be aggressively buying IWM or TNA calls to the upside.
The Russell has a different composition versus the S&P and the Nasdaq.
The “generals” have zero influence on this space. Instead, it’s broken up into things like biotech, regional banks, and all those little trashy stocks that had great moves in Q1 2021 and have since round-tripped.
Consider breaking it down into other sectors — watch KRE, XBI, and XRT.
VIX & VWIX
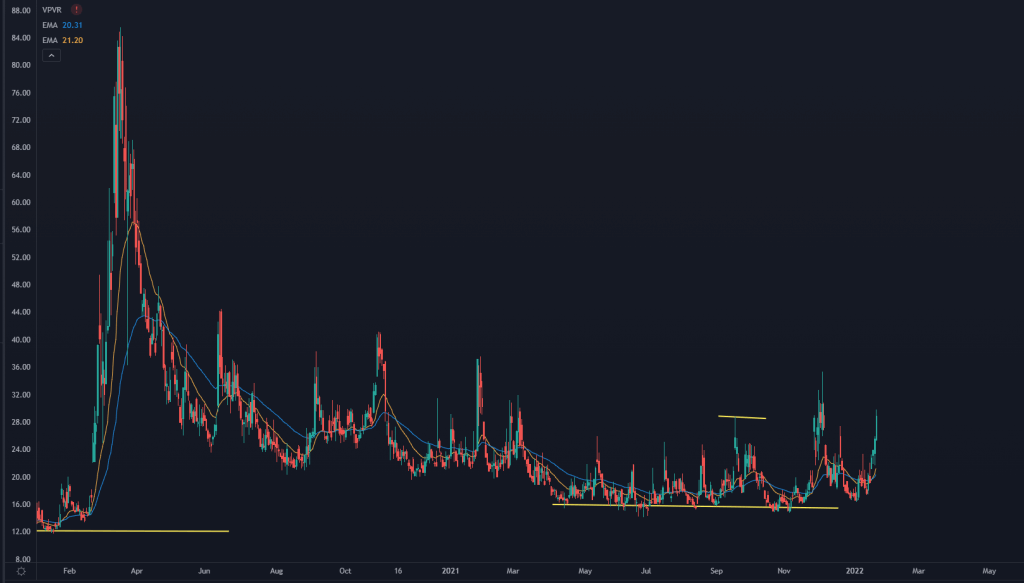
One thing that threw me for a loop last week was the “ho-hum” reaction in the volatility markets:
“This is what I can’t wrap my head around. The markets are looking pretty loose to the downside. Realized vol is at 15% so a 5 point premium makes sense, but we’re right at brink levels on a few things and the vol markets are unresponsive.”
“But you’ve got earnings coming up on deck to worry about, and if something like AAPL has a nasty breakdown, then we could see a market where we are underhedged again.”
We finally saw some panic in the volatility markets. VVIX, which measures demand for the VIX options market, cracked above 145 which has been “pretty close” to bottoms in equities.
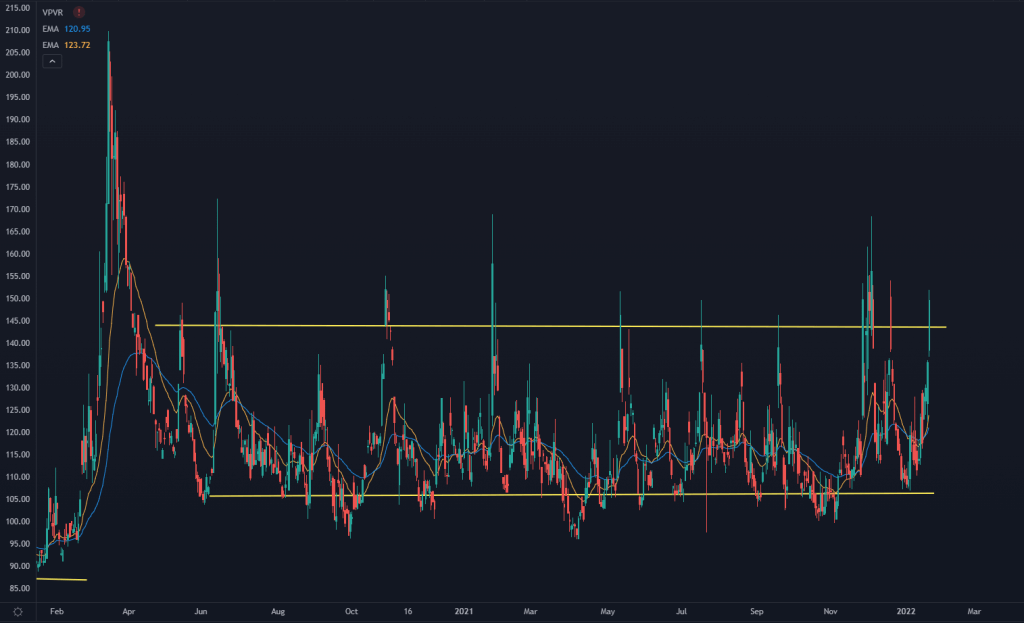
We also saw spot VIX trade up to 28, which would have been normal in 2020, but now is very elevated in our current volatility regime.
Remember, back in 2017, a VIX above 25 meant that the market was taking a huge hit.
It’s all about the current ranges that we’re in and how they will adjust as time goes on.
We also saw the VIX futures market finally hit backwardation:
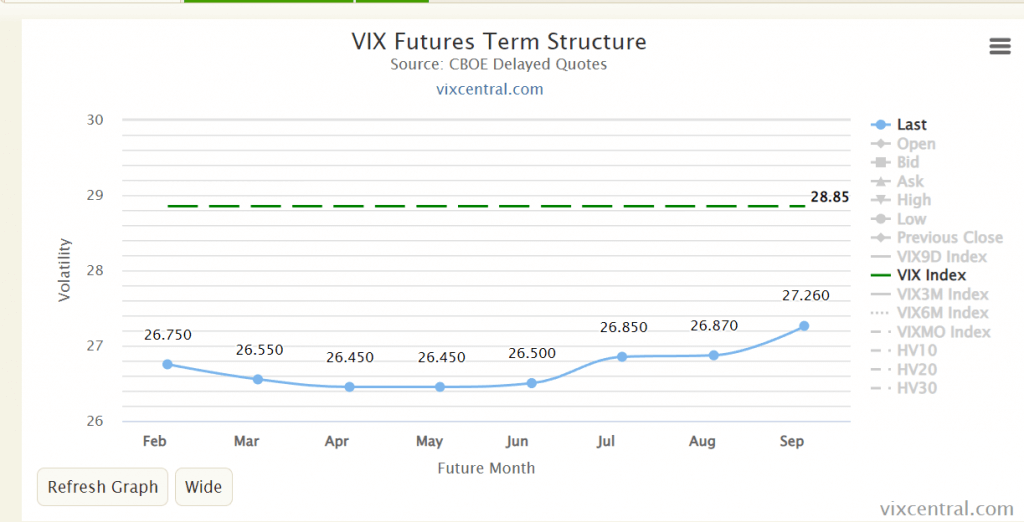
When we see a board like this, the risk either resolves fast…
Or things continue to cascade.
This sounds dumb, right? Markets go up and down…
But remember: They can also chop around sideways.
What we’re seeing in the vol markets further reinforces my belief that equity prices will not stick here.
This may not matter to straight stock traders, but for option traders…
It means you need to focus more on option buying and convexity bets.
That’s all for today. If you want more training on our roadmap and see it in action on other stocks…
Check out this training webinar.


