To start off 2022 strong…
I wanted to launch a new content series for you:
Index analyses.
We’ll use our market roadmap to do some in-depth analysis on the major indices, offering you 2 great benefits:
- Stay updated and informed on the market at large
- Learn the basics of our market roadmap to get an edge in the markets
I just put the finishing touches on the inaugural video — and, if you prefer to read, I wrote out my analysis in article format.
Check out the video here:
After you’re done…
If you prefer to read my analysis instead, continue on below.
SPY
First, let’s look at the S&P 500 — or, rather, its ETF, SPY:
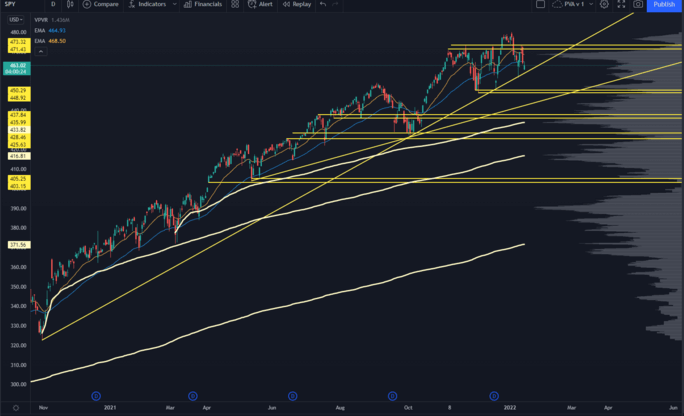
It’s holding onto its primary trend by a hair, and we have a very clear line in the sand at 471.50.
If we get a hold above that, we have high odds of trend continuation.
HOWEVER:
It’s still a reasonable thesis that a failed breakout setup is playing out in the S&P 500.
We had a low volume rally during the holidays, with a decent amount of profit-taking.
The 471.50 was resistance through November, and we had a successful retest and hold of that level.
There’s a tendency for the market to test the lower end of the range after a failed breakdown, and that could quickly accelerate if the intermediate-term trendline is broken.
Also, we’ve got a gap fill and key Low Volume Node (LVN) into 455.25 that’ll probably be the first bounce level.
Below that is a stupidly obvious support level that’ll have entirely too many eyeballs on it.
Either we don’t test it at all…
Or we (most likely) knife through it to get a proper stop run. That could truncate around $446.11.
If this is a local top, we could make a case for more of a distributive range getting knocked out.
Odds are any selloff wouldn’t be straight down…
But would instead be a higher volatility range that’ll churn everyone out — very similar to how the Russell 2000 has developed.
The bullish case is not the obvious one, other than the primary trend still being intact.
To see continued upside…
We’d probably need a combination of breadth along with earnings season, and maybe the Fed not being giant jerks with their talk.
The Fed thing still has many traders spooked. We can see that uncertainty in the wide rate expectations baked into the Fed Fund Futures market.
QQQ
Next, we have QQQ:
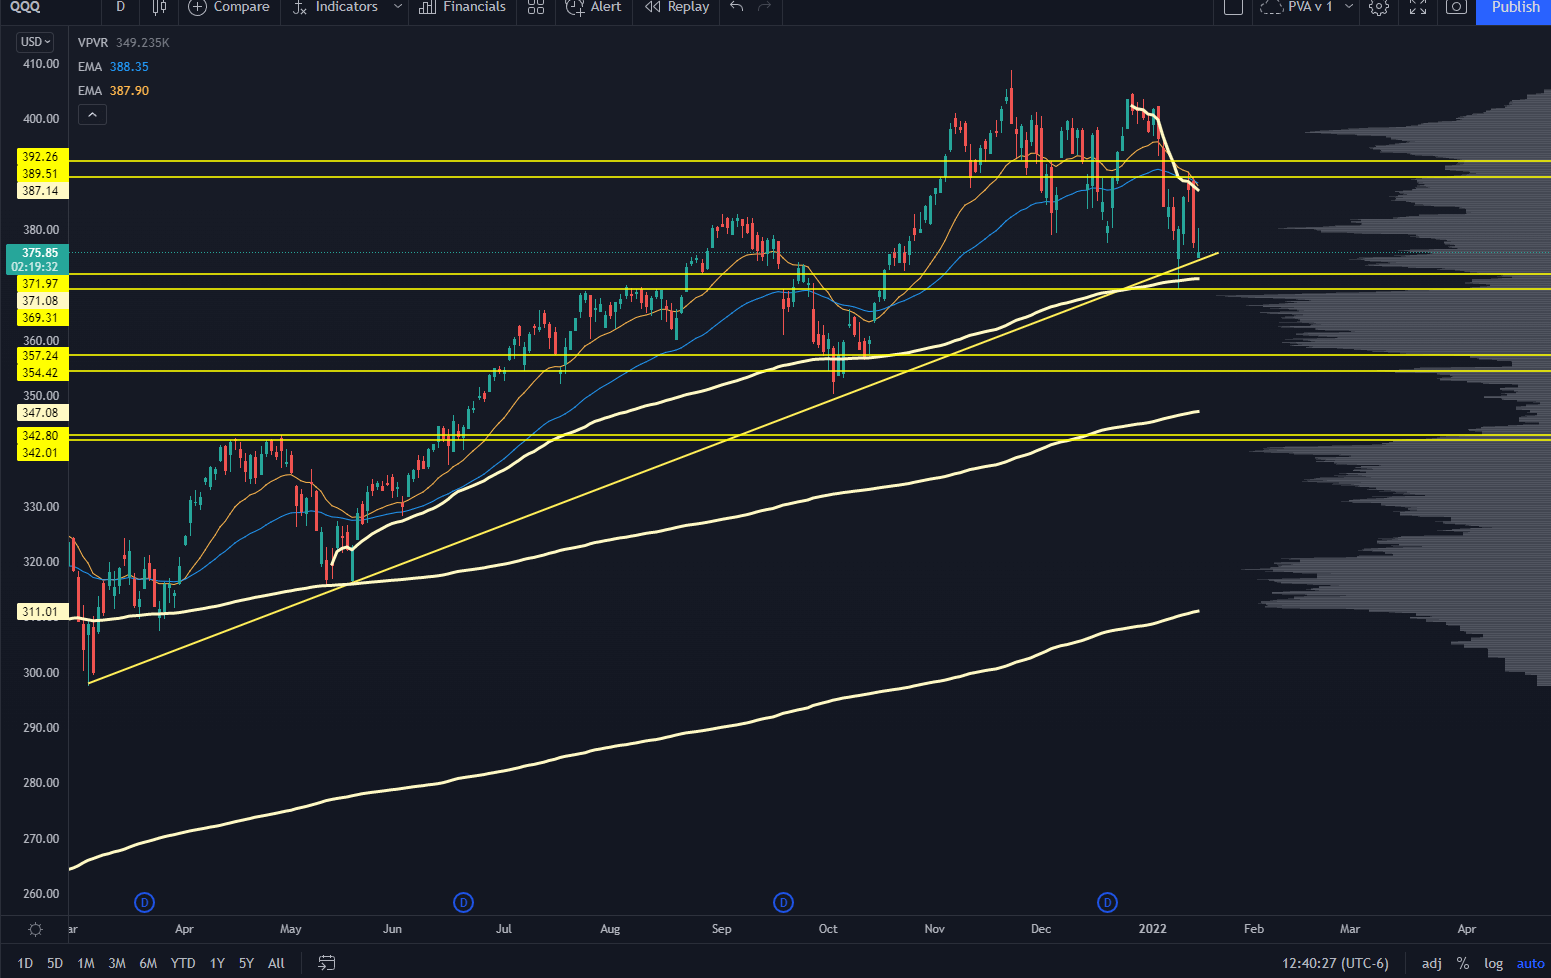
QQQ’s seeing a faster bearish turn than in other indices — mainly thanks to large-cap tech stocks.
Makes sense, given the rising rates narrative, which tends to hurt growth stocks.
But it’s also a function of how the big boys tend to take the hits last.
And given how well they’ve held up, it’s not a surprise we’re seeing some deleveraging.
The key turn was at 389-392, which is a key LVN. It was also the 20/50 ema and the swing AVWAP from the December highs.
This doesn’t mean we’ll crack and go straight down from here. There’s been a massive amount of volume traded between 355-370, and that prior liquidity footprint can slow down the selling.
If we do want to see a pull into the next big levels, that would be around 354-357, which is:
- A huge volume shelf
- Prior pivot levels
- And a key swing AVWAP that will come and catch up with price.
If that doesn’t hold, we’re looking at 342 quickly — it’s a huge volume pocket that delineates these two trading ranges. I’m treating that as a “brink” level, so it’s a higher conviction support level.
And to put that in context, 342 is like 15% from all-time highs.
People would treat it like the end of Western capitalism (again)…
But it would be a great longer-term dip buy.
This market is trading exceptionally well on a technical basis, so we’ll keep focusing on those levels and bet on more range-bound action.
One more thing:
It’s possible we overshoot the week’s lows, but not on as much momentum. That would create a divergence and put in an intermediate-term low.
IWM
Small-cap time. Let’s look at IWM, the ETF tracking the Russell 2000:
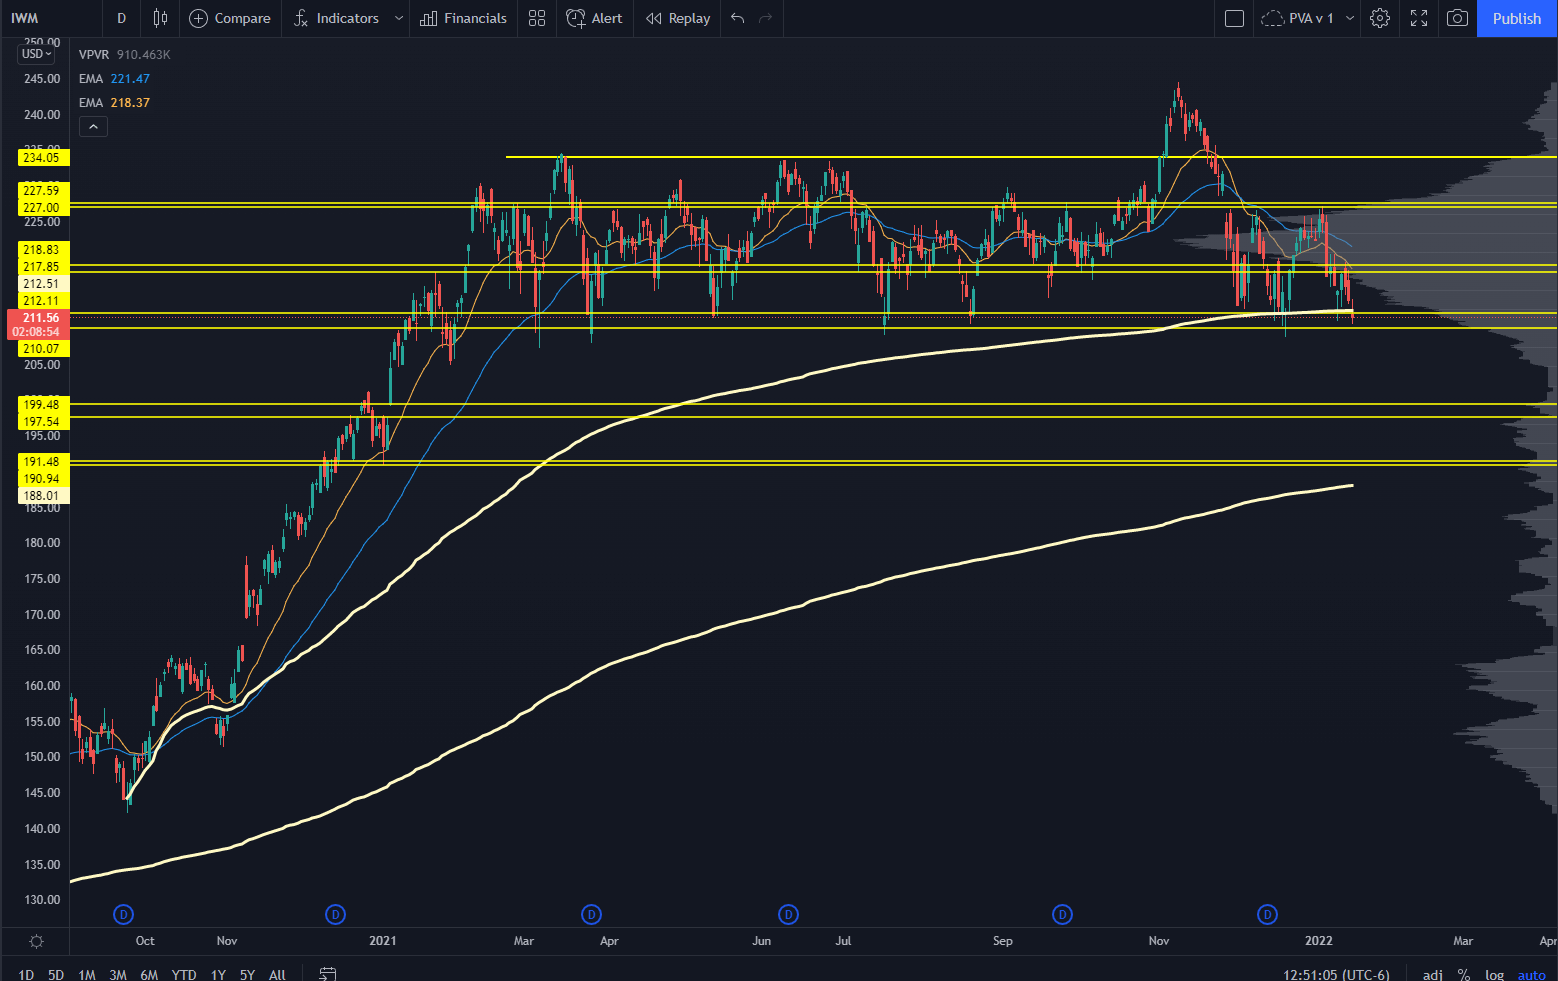
This is the spooky one.
The Russell 2000 has been in a range for well over a year. It did attempt to break out in November…
And it was a clown show afterward.
From the failed breakout came the move to the other end of the range. For the past few months, the IWM has teased this 227 level that’s been an internal pivot level for a while.
IWM keeps holding just underneath that level, which is a pretty significant change of character.
Now, we’re sitting at a key brink level. Finding levels underneath this is pretty tough because we simply haven’t seen a ton of trading volume under here.
Pulling into 199 would be about a 20% pullback — and if it happened a little slower, then we’d see the AVWAP from the March 2020 lows come into play.
Something should be said right now about the index composition for the Russell:
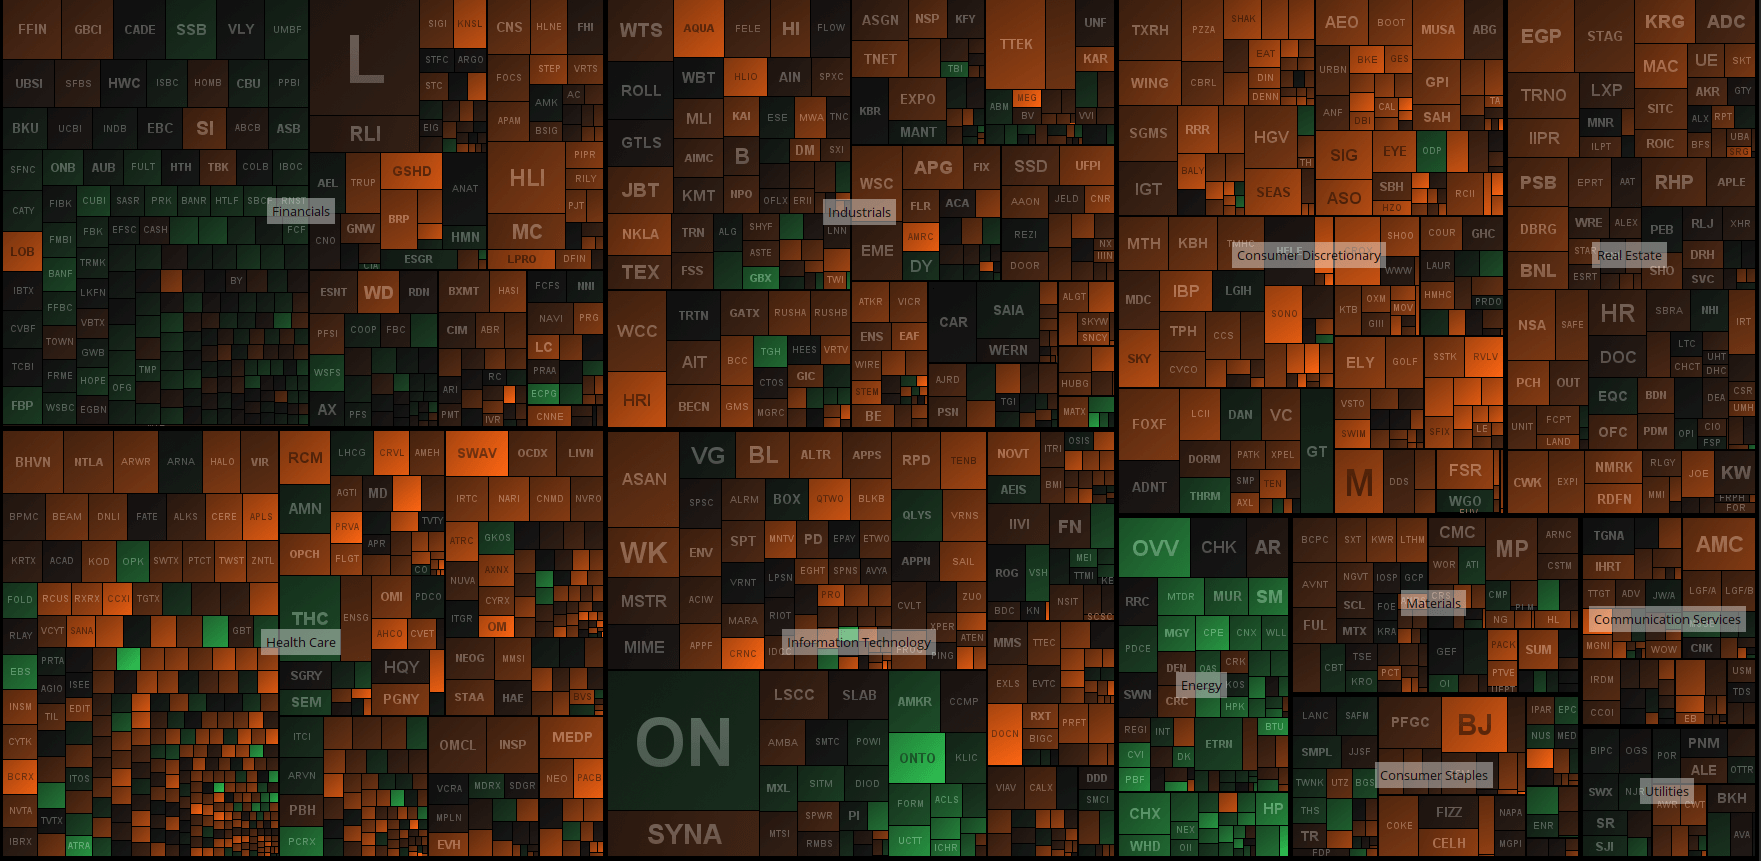
So the energy sector looks fine. So do banks, and those are rates plays.
Now, you’ve got the Cons.
Discretionary getting hit, most likely on retail sales numbers.
Real estate is probably a rates proxy play as well.
And then you’ve got health care, AKA biotech…
And holy smokes, it’s bad right now.
Small-cap biotech has seen a nasty cascade to the downside…
But it does have some potential levels in play just below here.
So if biotechs bounce and rates normalize a bit, then you can get a stick save in the Russell 2000 again.
We’ve seen that scenario play out multiple times over the past year or so:
Every time the Russell looked like it was about to get blasted, it somehow managed to find buyers in the right sectors, offering a push back to at least the other end of the range.
VIX
Finally, let’s look at VIX. This is the CBOE’s Volatility Index, measuring the market’s volatility expectations based on S&P 500 index options:
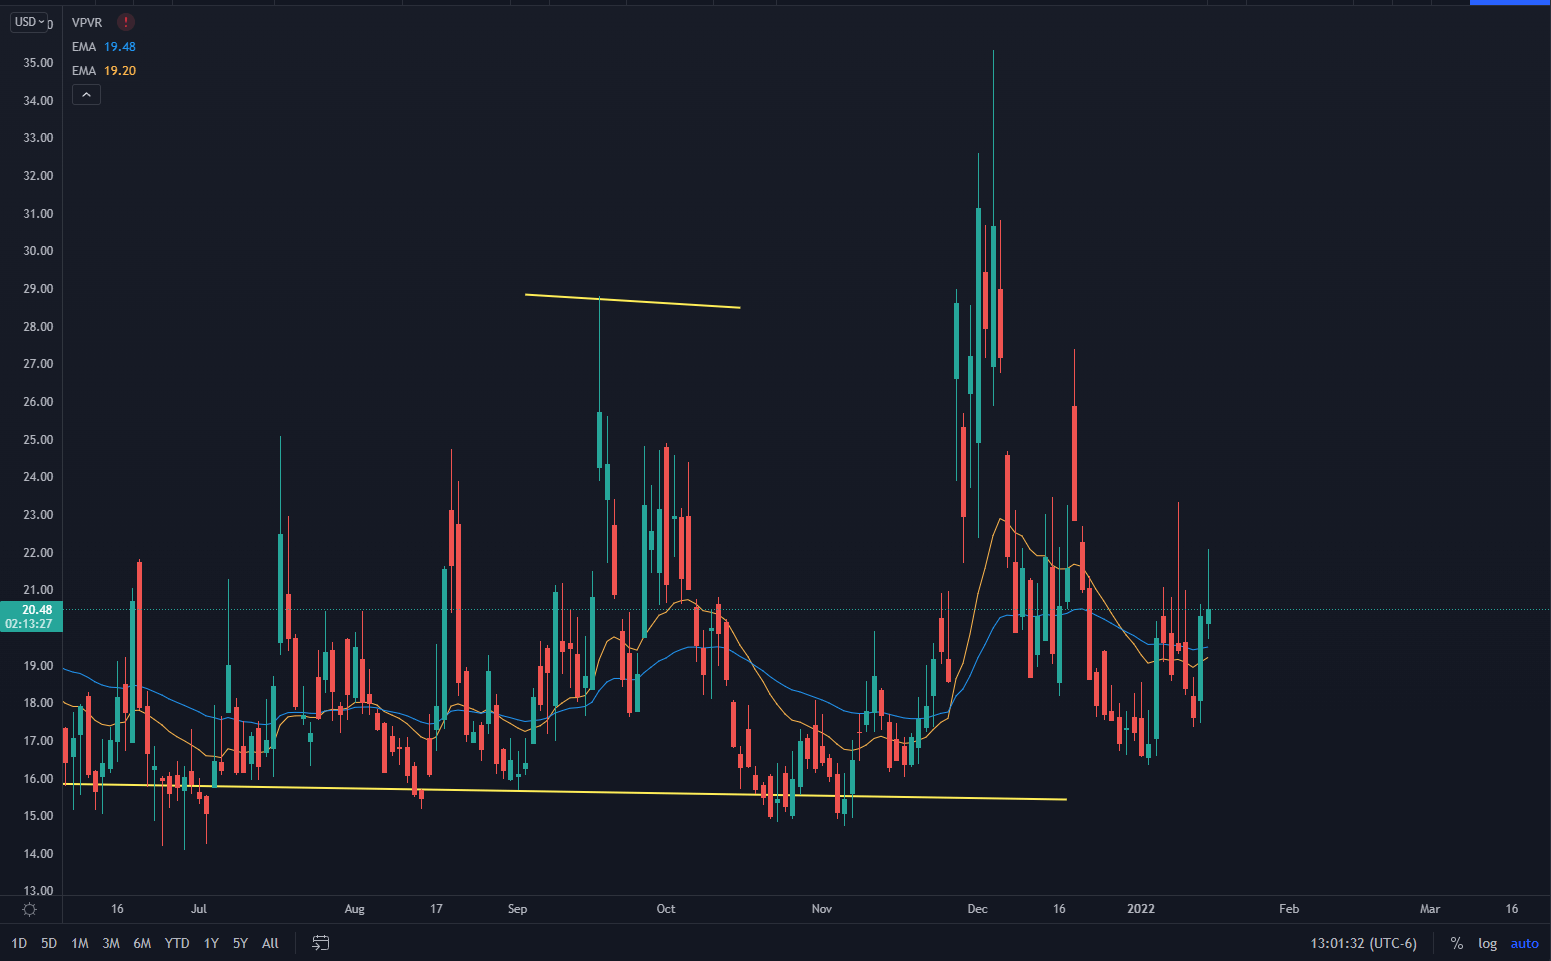
I truly can’t wrap my head around this one.
The markets are looking pretty loose to the downside. Realized volatility is at 15%, so a 5 point premium makes sense…
But we’re right at brink levels on a few things, and the volatility markets are unresponsive.
We’ve talked previously about how too many people were hedged during the nasty move lower in December. And we just aren’t seeing that kind of responsiveness in the VIX markets.
Many known risks may be out there already, making it easier to price in risk without worrying about liquidity. The Fed moves are pretty telegraphed right now, bonds are making their adjustments, and so on.
But you’ve got earnings coming up on deck to worry about, and if something like AAPL has a nasty breakdown, then we could see a market where we are under-hedged again.
That completes today’s roadmap analysis.
It was a lot, I know. Feel free to watch the video at the top of the page if you need to.
Or, on the other hand…
Check out this training to learn more about our roadmap and how to use it yourself!


