
📌 Callum Thomas, Head of Research at Top Down Charts, published his weekly SP500 ‘chart storm’ and we think it is imperative to review a few of them in this section as those can add a lot of value to your trading in the weeks ahead.
Thomas’ SP500 Chart Storm
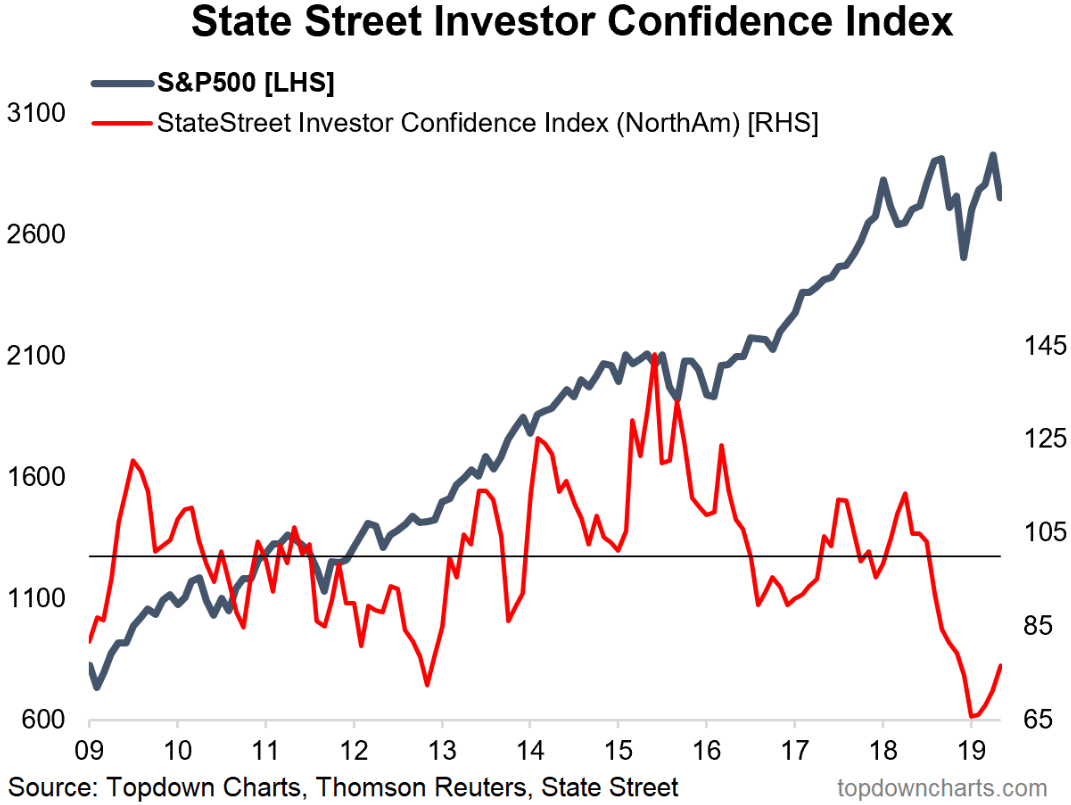
📌North America institutional investor confidence index just as investors began putting their toes back in the water.
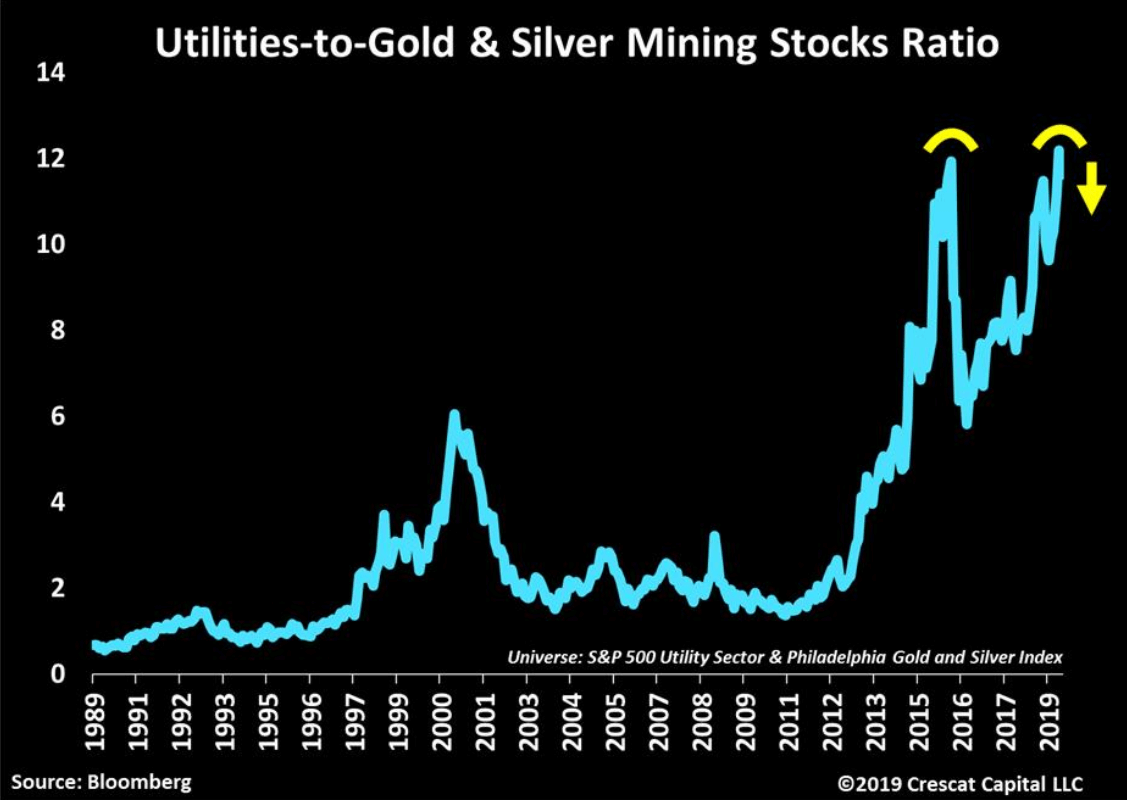
📌Interesting chart by Otavio Acosta [Crescat Capital | Global Macro-Analyst], Utilities boosted by ZIRP+QE, Gold miners bungled by the Gold bear market. Someday a mean reversion trade will make sense.
SP500: Who is going to bite the dust?…Bulls or Bears
Hawkeye Traders [Volume Price Analysis | SP500 Futures]
The week ahead poses two relevant questions:
- If these Tariff games were to continue; Who ends up winning? (if we ever have one)
- How much damage is required in ‘trade’ for countries to play along at least in the medium-term?
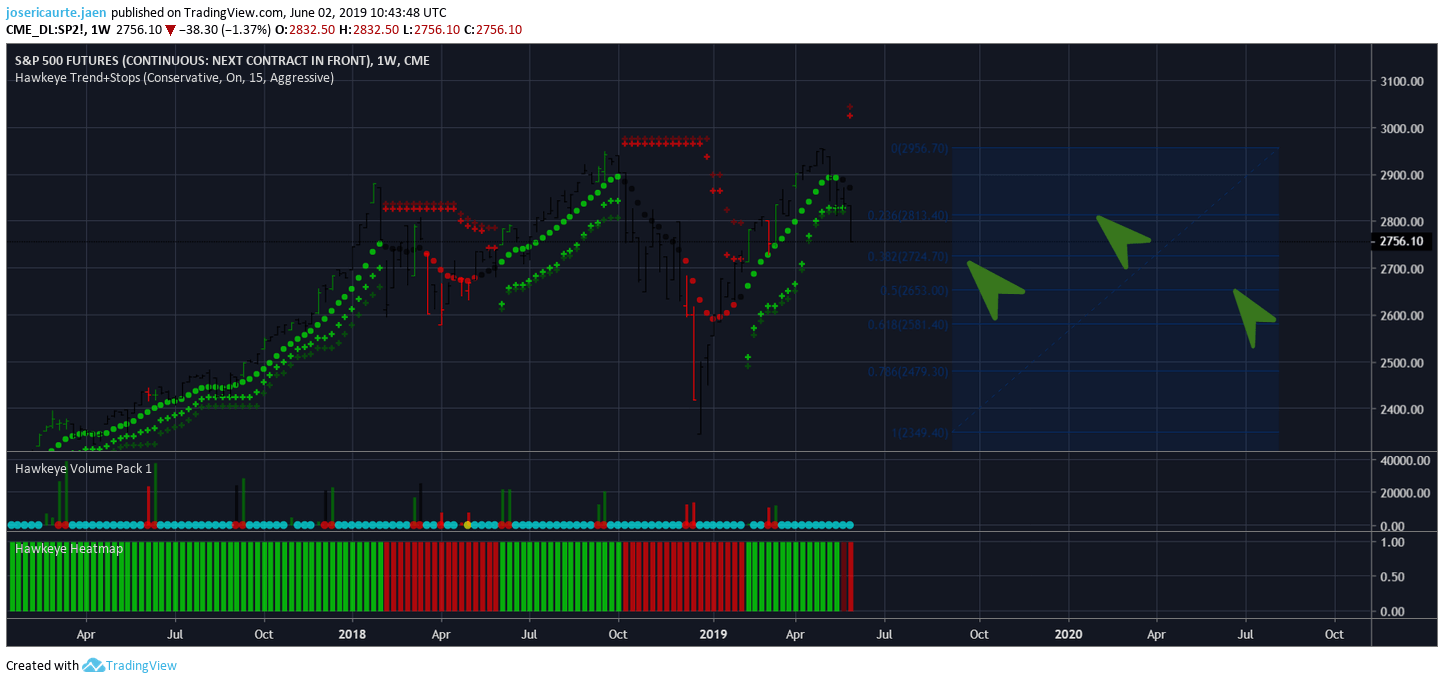
SP500 Technical Levels to Watch
The first line to watch is May’s high at 2832.50 because until the index breaks up -opening and closing- this level no article should circulate calling for a bullish trend in equities. On the other hand, projecting Fibonacci from December 24th, 2018 lows at 2344.20 to April 29th highs at 2955 provides a more specific roadmap to trade:
- Price rotation must be expected between 2811 (23% Fibo) to 2653 (50% Fibo). A middle ‘point of control’ rotates around the 2724 level (38.2% Fibo).
All in all, volatility seems to be back in the game providing multiple trading opportunities. In fact, this is your chance to explore ‘Volume Price Analysis’ and see how effective the strategy can be to improve your returns as you learn to reduce your downside by waiting for the volume to fine tune your entries 📘Free E-Book | 🔋 Volume Price Analysis via Hawkeye Traders


