Back in the 90s tech bubble, there was a fund that could do no wrong. It was called Janus.
It had a stellar track record, tons of inflows, and they were picking the hottest stocks in the market.
(Can you guess how this ends?)
At the top, Janus had $318 billion in assets. Then it got absolutely crushed when the bubble burst.
Fast forward to the modern markets.
In 2021 we had meme stocks running, Archegos making leveraged bets on tech momentum names, and a new name popped up in the investor zeitgeist.
Cathie Wood.
I could go over the media’s worship of the ARK funds, but it’s just as easy to share a headline from last year:
Really?
That’s what you’re going with?
You know that as soon as you say a fund manager’s doing “God’s work”…
It’ll mark the end!
Now, this headline was written on March 12th, 2021. Let me show you a chart for some context:
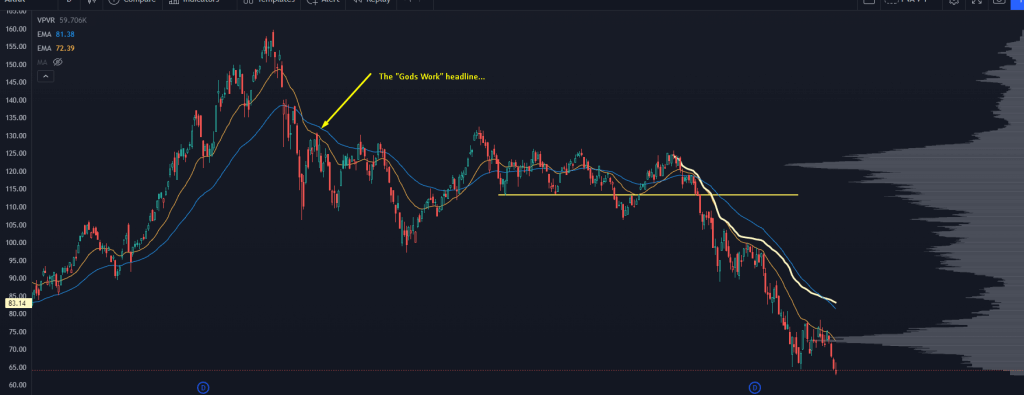
ARKK, the flagship tech etf, is now about 60% off the highs, and we now come into a very interesting question about negative convexity in this market.
Here’s how the “flywheel” works:
ARKK invests in tech growth names. Companies you may have heard of, like ROKU and TSLA.
If the fund underperforms, some investors might sell their positions in the ETF.
The ETF custodian (ARK) then has to go and sell some of the stock they own because of these fund redemptions.
So they’ll sell some TSLA and ROKU, which is fine…
But what if the name they have to sell isn’t very liquid? What if enough traders get wind of the forced selling that has to happen…
And the illiquid stock tanks?
That then forces the value of the ARKK fund lower, which causes redemptions, which leads to them selling more illiquid holdings…
And that’s where it can get ugly.
Now that I’ve got you all beared up, let’s come off the ledge a bit.
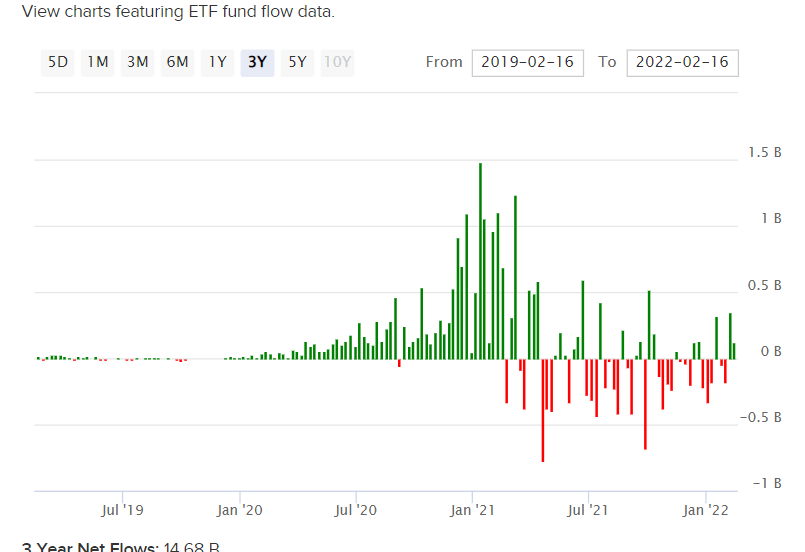
ARKK has already seen a good chunk of outflows during this bear market:
And while the names they own can continue lower, they will soon end up with a floor setup soon.
Which leads me back to the chart of ARKK, zoomed out:
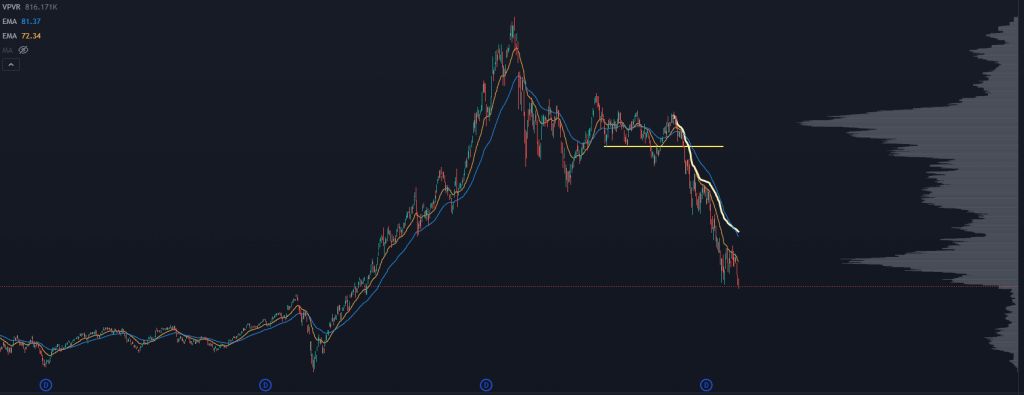
On our Trading Roadmap, we have something called a “shelf” right around the ETF’s current price.
This means we’ve seen plenty of volume at this current price, but just underneath it’s a large volume pocket.
A “brink” level like this can sometimes mean we’ll see a fast move through it because there’s no prior demand at these prices.
Yet, when we have a level like this after a 60% selloff…
It can sometimes act as a hidden support level.
I’m not guaranteeing a bottom here — that’s not how trading works.
But if we start to see the stock firm up as it trades in the low 60s, don’t be surprised if we get a monster rip higher in these high-growth tech stocks.
I’d also recommend looking at individual names held here for good bets. Many names are coming into huge levels, and call options are starting to look very attractive from a risk/reward viewpoint.
At PVA, we’ll be monitoring for setups in some of these names using our Trading Roadmap.
Head here to learn how you can take advantage of our Roadmap system today.