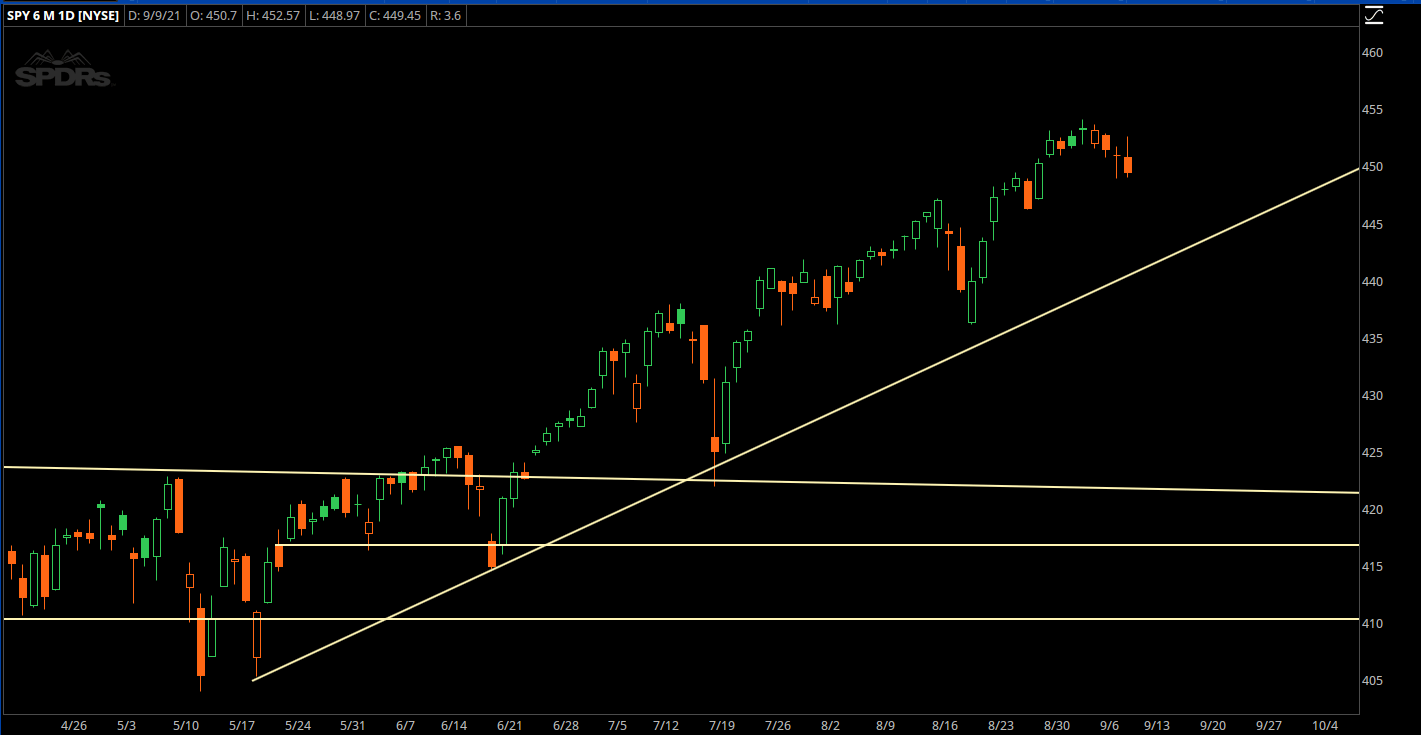
I want you to take a look at this chart of the S&P 500.

Notice any patterns?
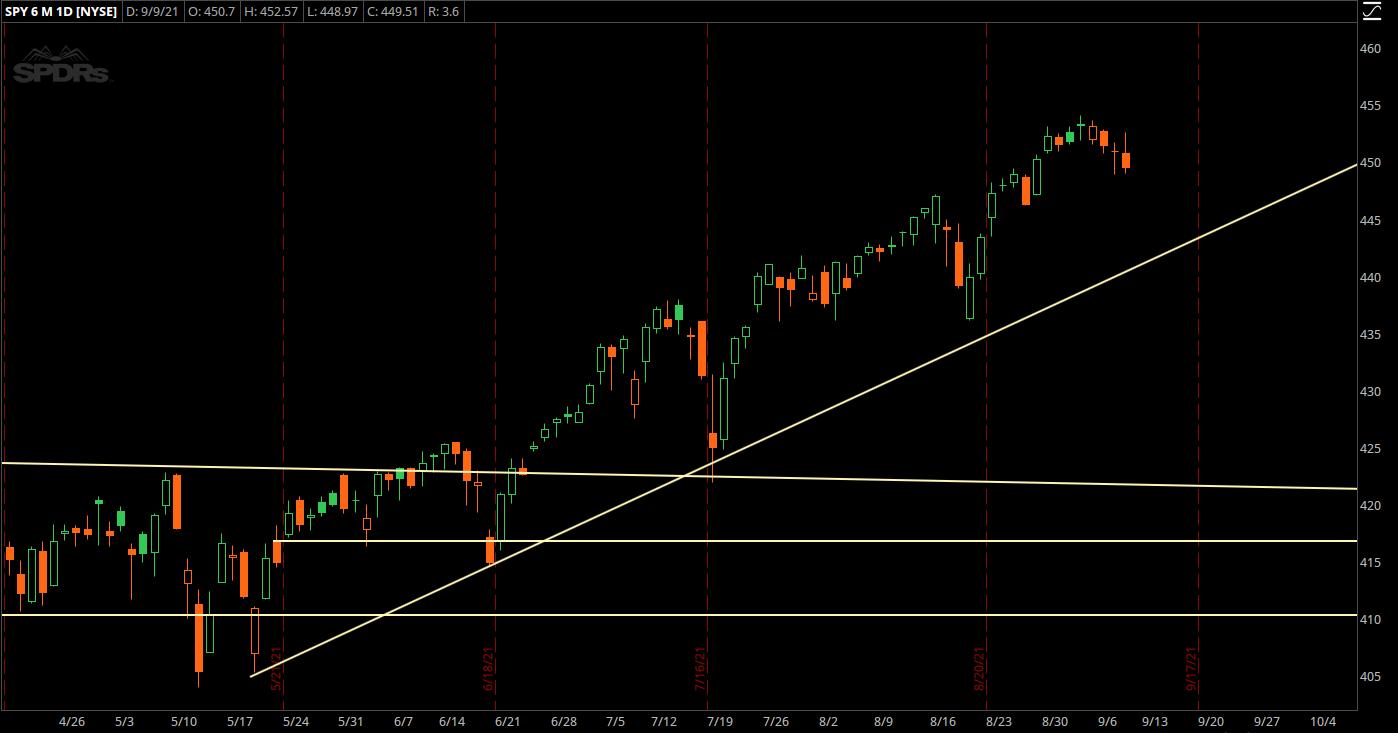
What if I place a line showing options expiration:

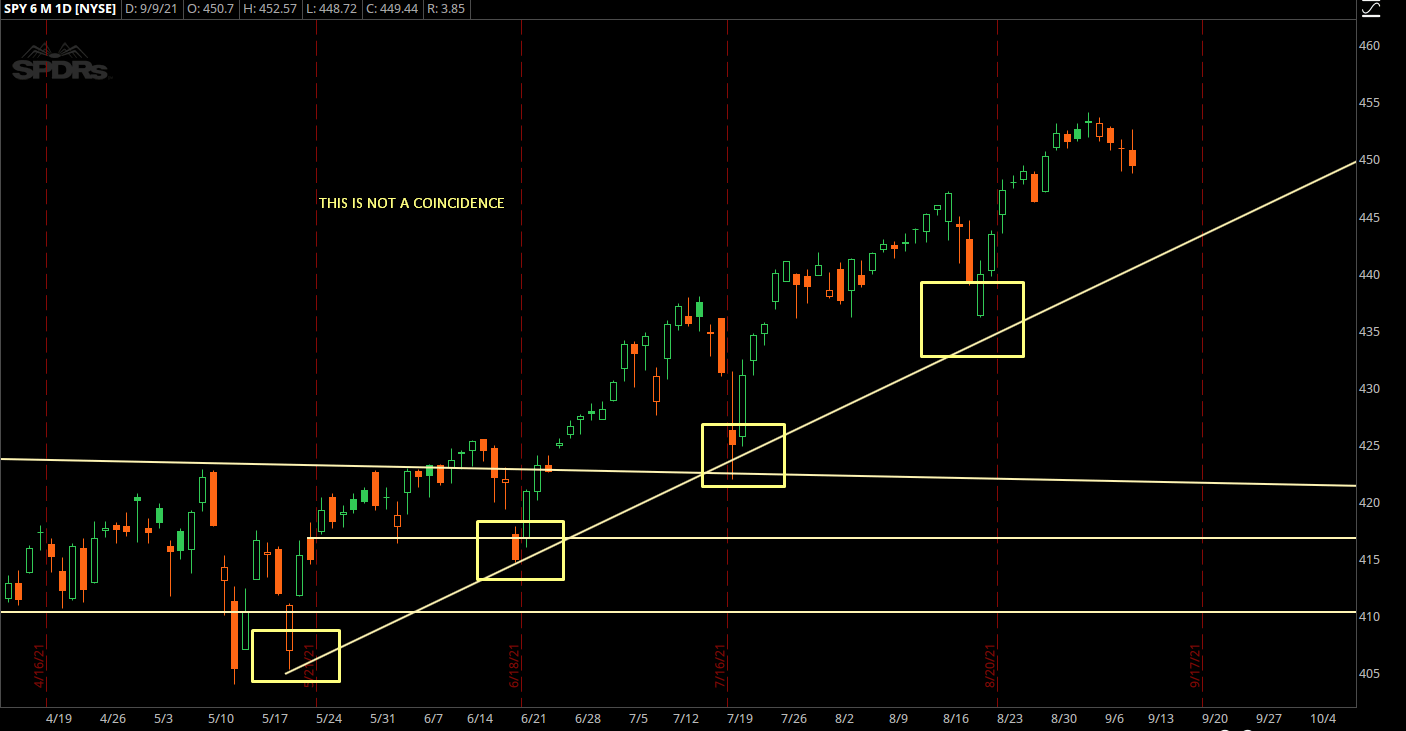
Isn’t it odd that we seem to have a hard selloff right around options expiration?
There’s a not-so-simple explanation for this, so allow me to take you down the rabbit hole of how markets operate in 2021.
No Liquidity In Sight
After the crash and bounce in 2020, liquidity has been trash in the market. The overall size on the bid/ask in the futures market has gone down. We’re seeing runs in “meme stocks” because there is no liquidity supply.
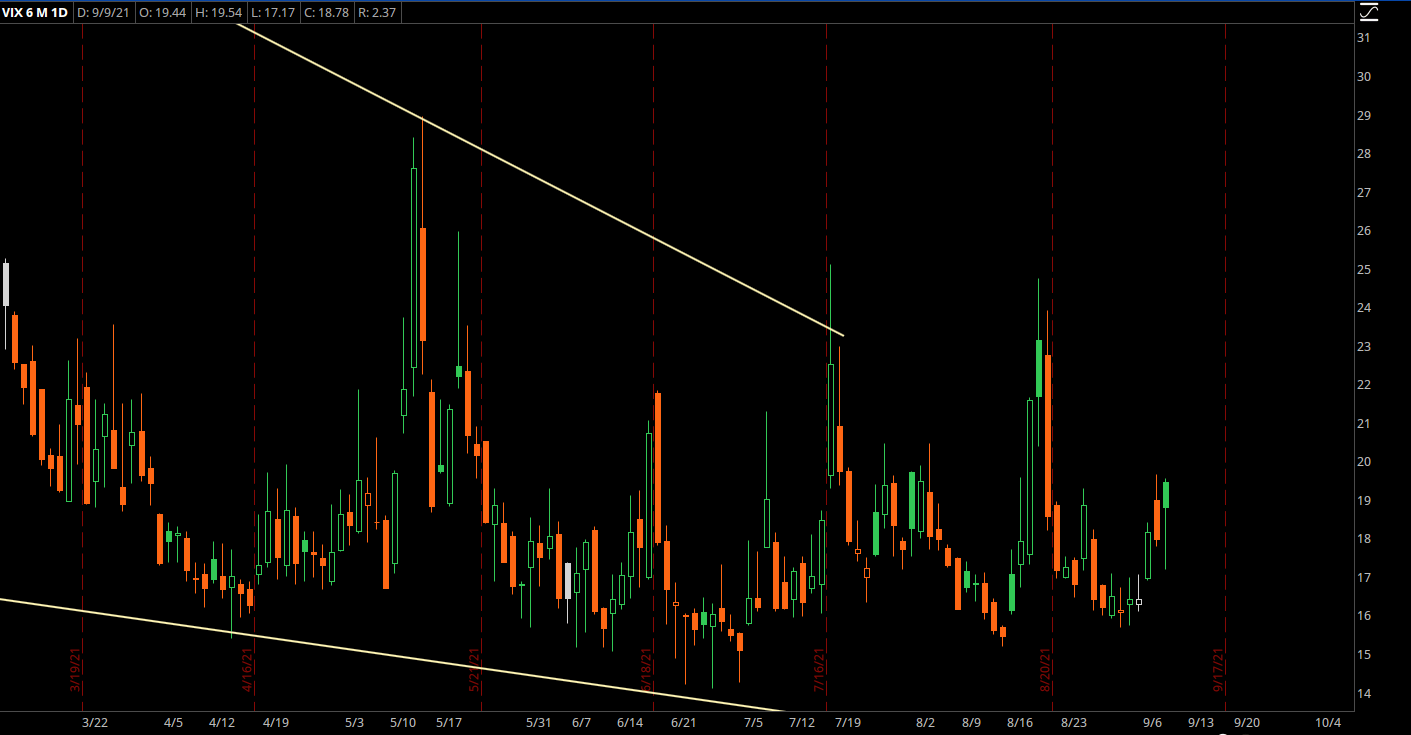
Everyone knows this. And the options market knows this, which is why we are seeing a very high VIX reading:

If you’re not familiar, VIX is short for the Volatility Index. The VIX basically reads the implied volatility of S&P 500 Index options. And it’s one of my go-to tools when calibrating my trading strategy.
The VIX currently has a floor around 16. If this were pre-2020, we’d be seeing lows around 10-12. But because liquidity is trash, nobody wants to be in this market without any kind of hedging.
Which leads us into the “shampoo bottle” hedging trade.
Hedge, Rinse, Repeat.
Traders don’t hedge when things are going great, they hedge when they are scared.
So when the market drops, they panic and start buying all sorts of things…
– S&P puts
– VIX calls
– VIX futures
And guess what happens?
If everyone and their mother is hedged, it puts a natural floor in the markets.
Let’s think about the mechanics here…
If a trader hedges, then if the market sells off more, they don’t need to hedge again.
That’s how the selling stops, and you move to the rinse cycle.
When the market is overhedged, there’s a tendency for a fast rip back to the upside.
There’s two main mechanics behind this.
First, you have the market makers that will buy the market as it goes higher. It sounds weird, yet that’s just normal behavior for them.
If a trader buys a put, the market maker is now short that put, and they will short the market to cover their exposure. If the market bounces, they’ll start to remove that short exposure.
The second part of the squeeze is when funds start selling calls in size. Into any market rip, they’re forced to cover in order to protect against losses.
That’s the “Rinse” cycle.
So, what does “repeat” look like?
The final part is the “Repeat.” At some point, the hedges bought by scared traders will burn off, leaving them exposed again.
And we’ve seen the “Repeat” for 4 months in a row now.
In a “normal” market this wouldn’t matter, because there’s enough liquidity to deal with it.
But not anymore.

As we head into September options expiration, many of the hedges are at lower strikes, and they offer very little protection. Anyone who got caught short calls into the upside squeeze have been taken out. There’s now a vulnerability in the market where volatility could start picking up again.
Fool Me Once…Or Five Times?
Many times when price patterns are too obvious, they stop working. If you get too many eyeballs on the same trade, then the trade can easily break.
The “volatility around opex” trade has been around for a long time, yet it’s never been as pronounced as it is right now.
I think this round we could easily see the trade break. Too many are conditioned for that shallow dip, and this could be the time where traders are punished.
As we head into the Fall, make sure that your positions can survive a “stress test.”
Consider hedging up when you can, before you have to. It’s better to have it, and not need it, than to need it and not have it.
And watch price action for any signs of failure here– because it can be a swift move to the downside if we see too much complacency this time around.
I know that might’ve been a little “technical,” but hey, I’m a market “nerd.” You won’t find this kind of intricate trading breakdown anywhere else.
Now if you want to see how I turn this kind of nuts & bolts market analysis into cold, hard profits…


